Section heading
Highlight 1
Highlight 2
Highlight 3



Heading
Value 1
Label 1
Value 2
Label 2
Value 3
Label 3
Section heading
Add the section description.

Section heading
Heading
Value 1
Label 1
Value 2
Label 2
Value 3
Label 3
Section heading
Section heading
Section heading
Heading
Value 1
Label 1
Value 2
Label 2
Value 3
Label 3
Highlight 1
Highlight 2
Highlight 3
Section heading
Section heading
Section heading
Add the section description.
Heading
Value 1
Label 1
Value 2
Label 2
Value 3
Label 3
Section heading
Heading
Value 1
Label 1
Value 2
Label 2
Value 3
Label 3



A smarter way to navigate Google’s global footprint

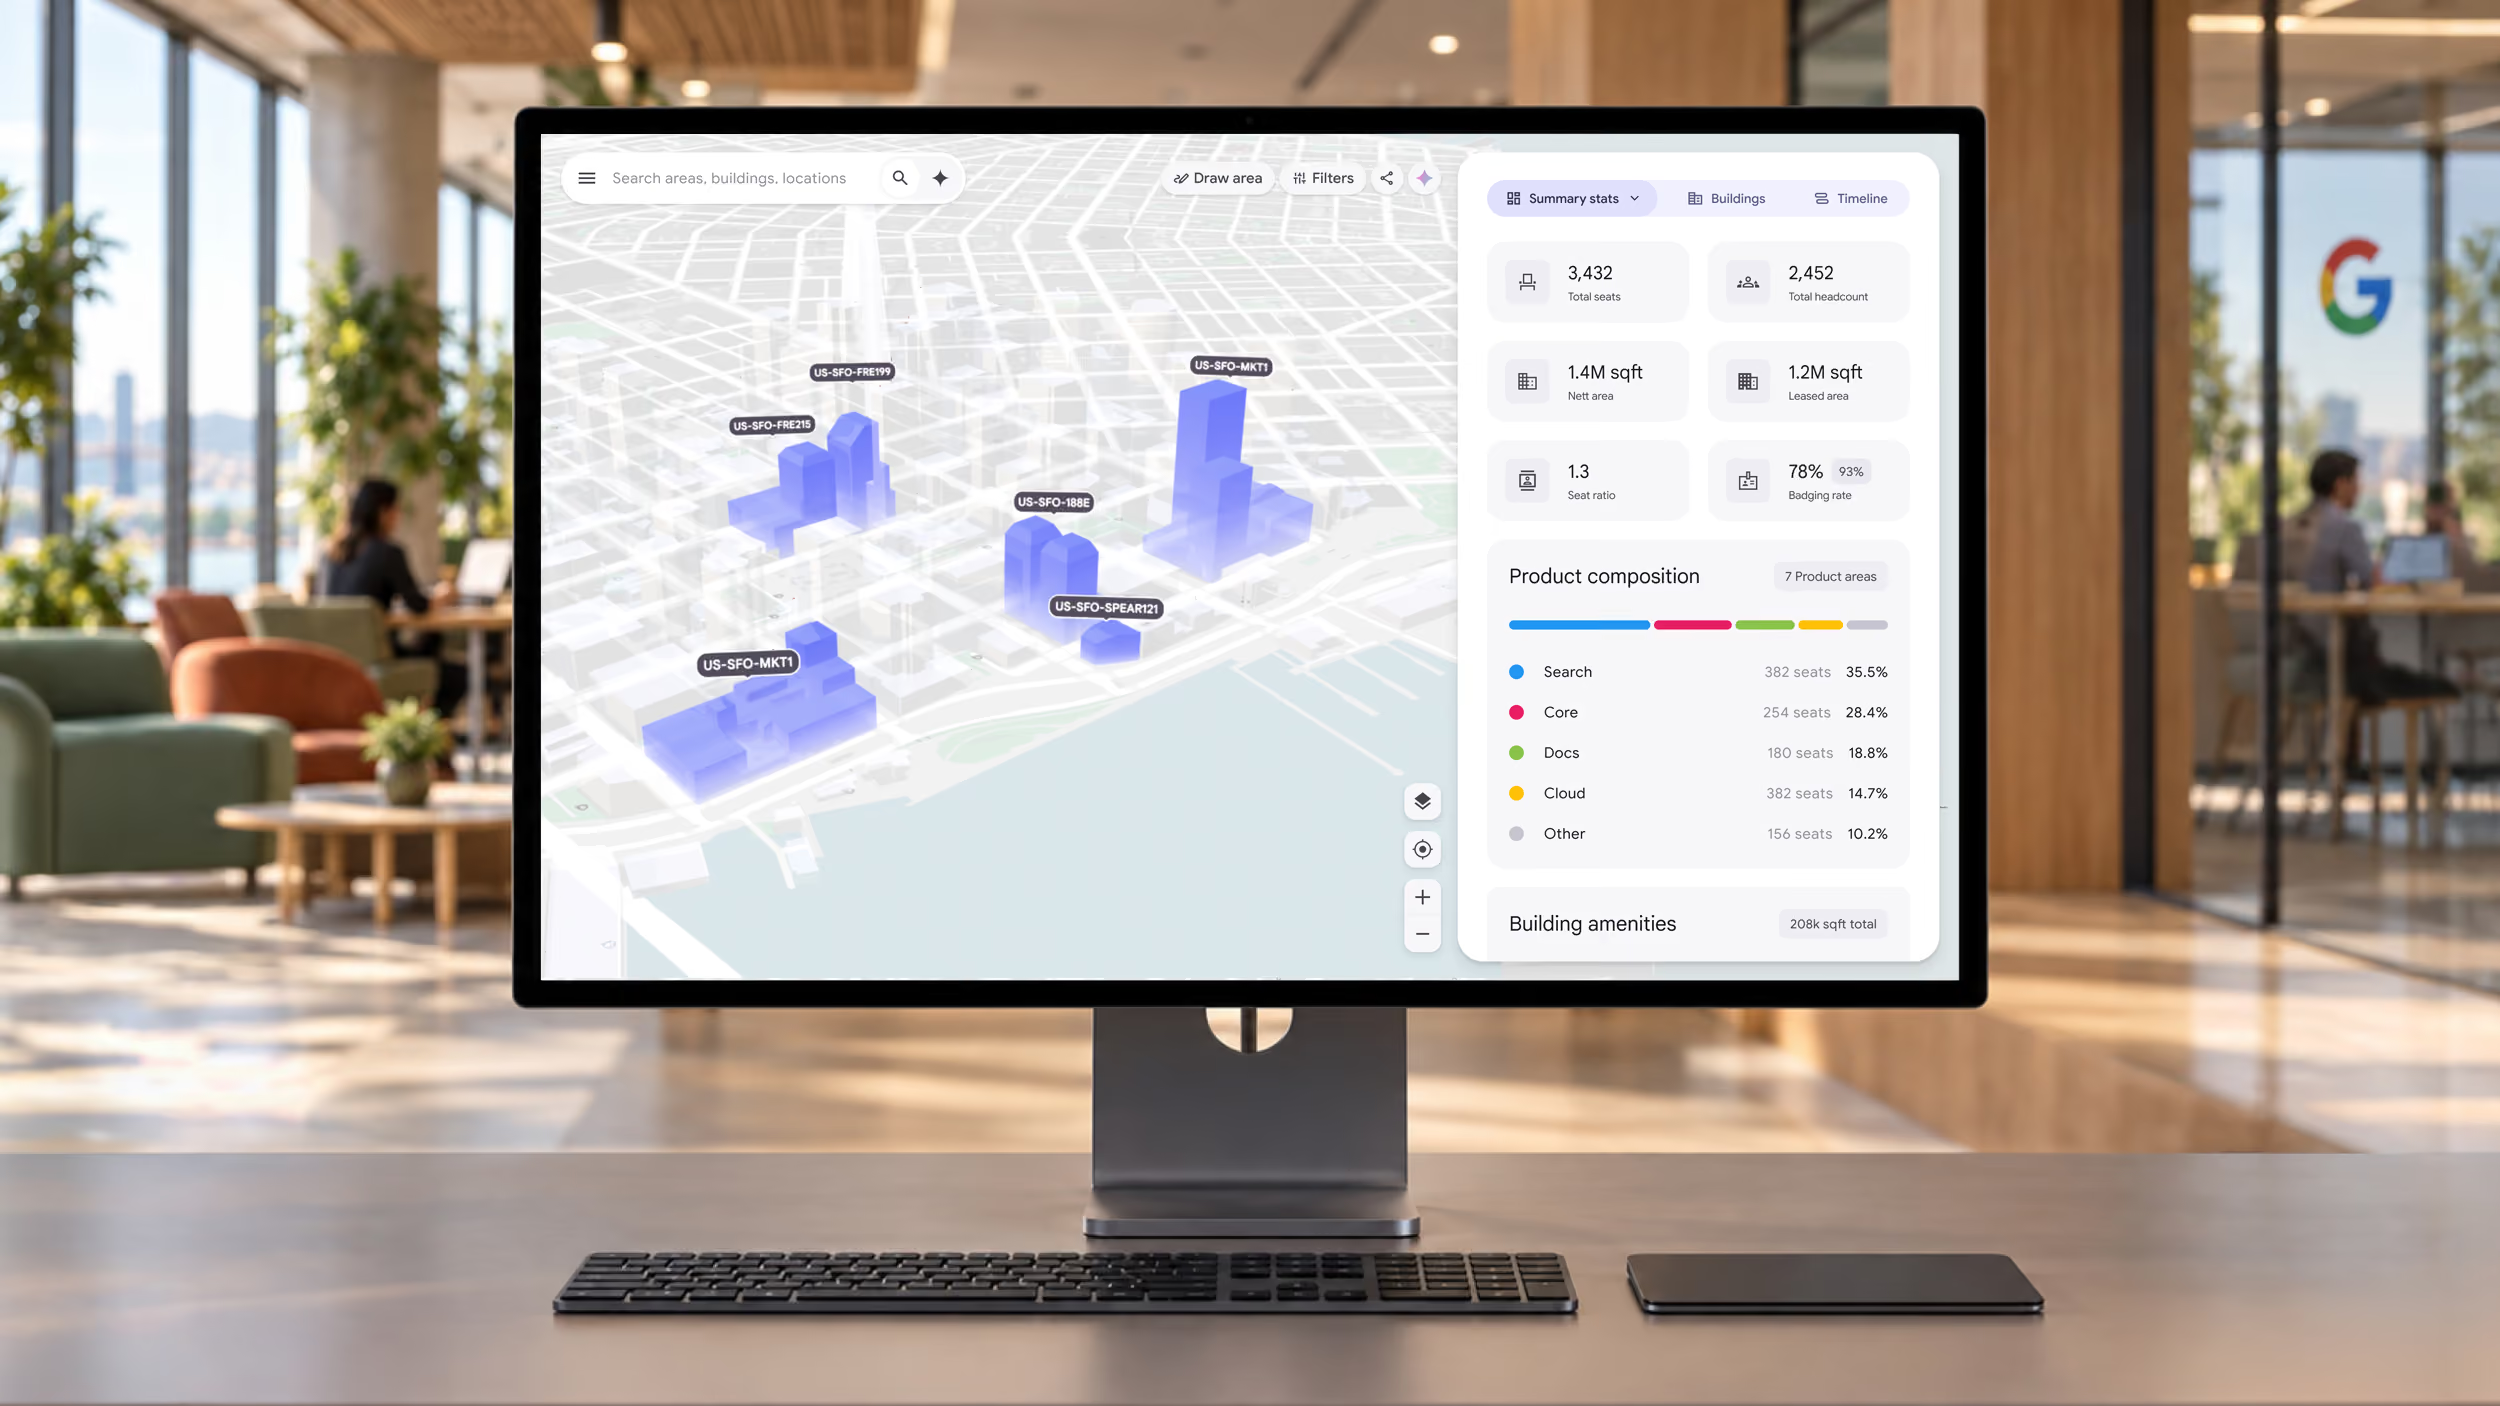
Google manages thousands of buildings worldwide. We built a next-generation mapping product to bring that footprint into one view, helping teams search, explore, and answer questions in seconds.
Unified building data from 10+ systems into one interactive map experience.
Made complex real estate data accessible through natural-language AI and map-based insights.
Scaled from initial idea to an operating platform used by thousands of enterprise stakeholders worldwide.
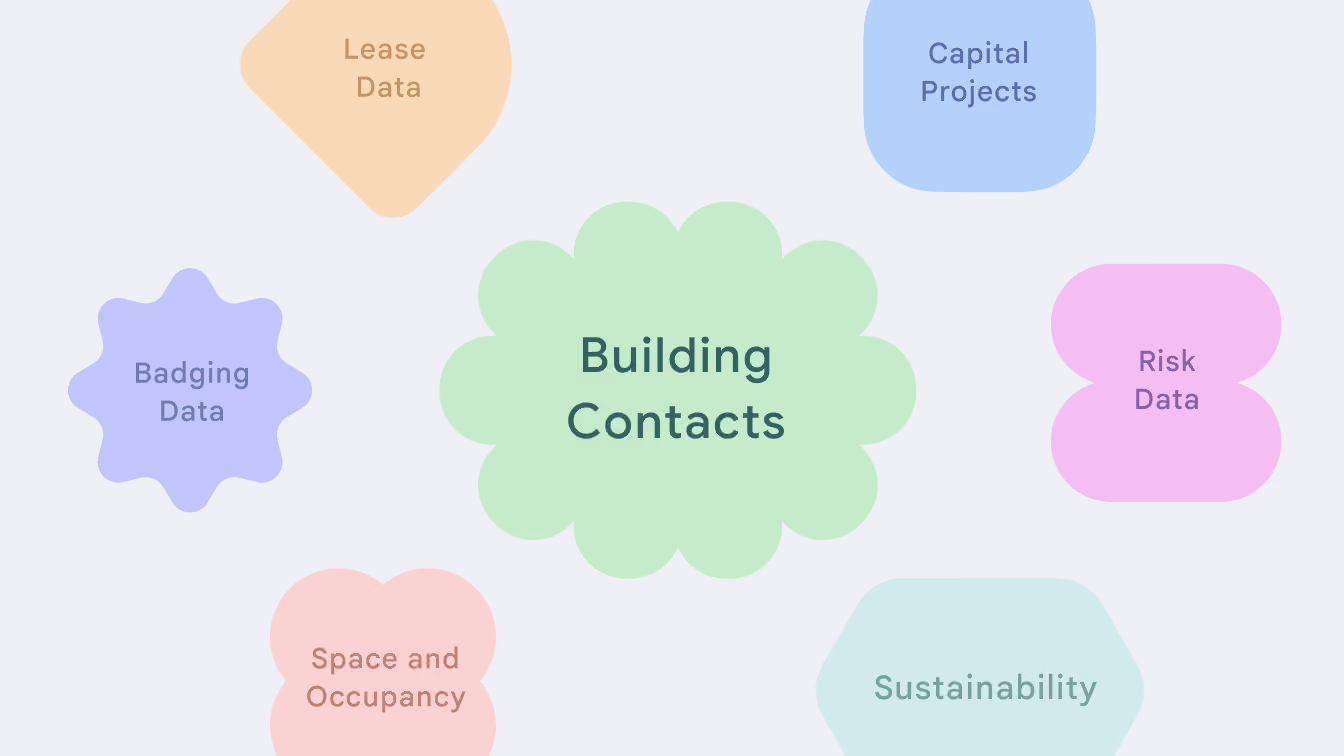
Google’s workplace spans thousands of buildings across 60+ countries. Each site has constantly changing details, from meeting room availability to parking closures, elevator outages and construction detours. With that information spread across dozens of systems, even simple questions meant piecing together answers from fragmented sources.
One place to understand any building in context
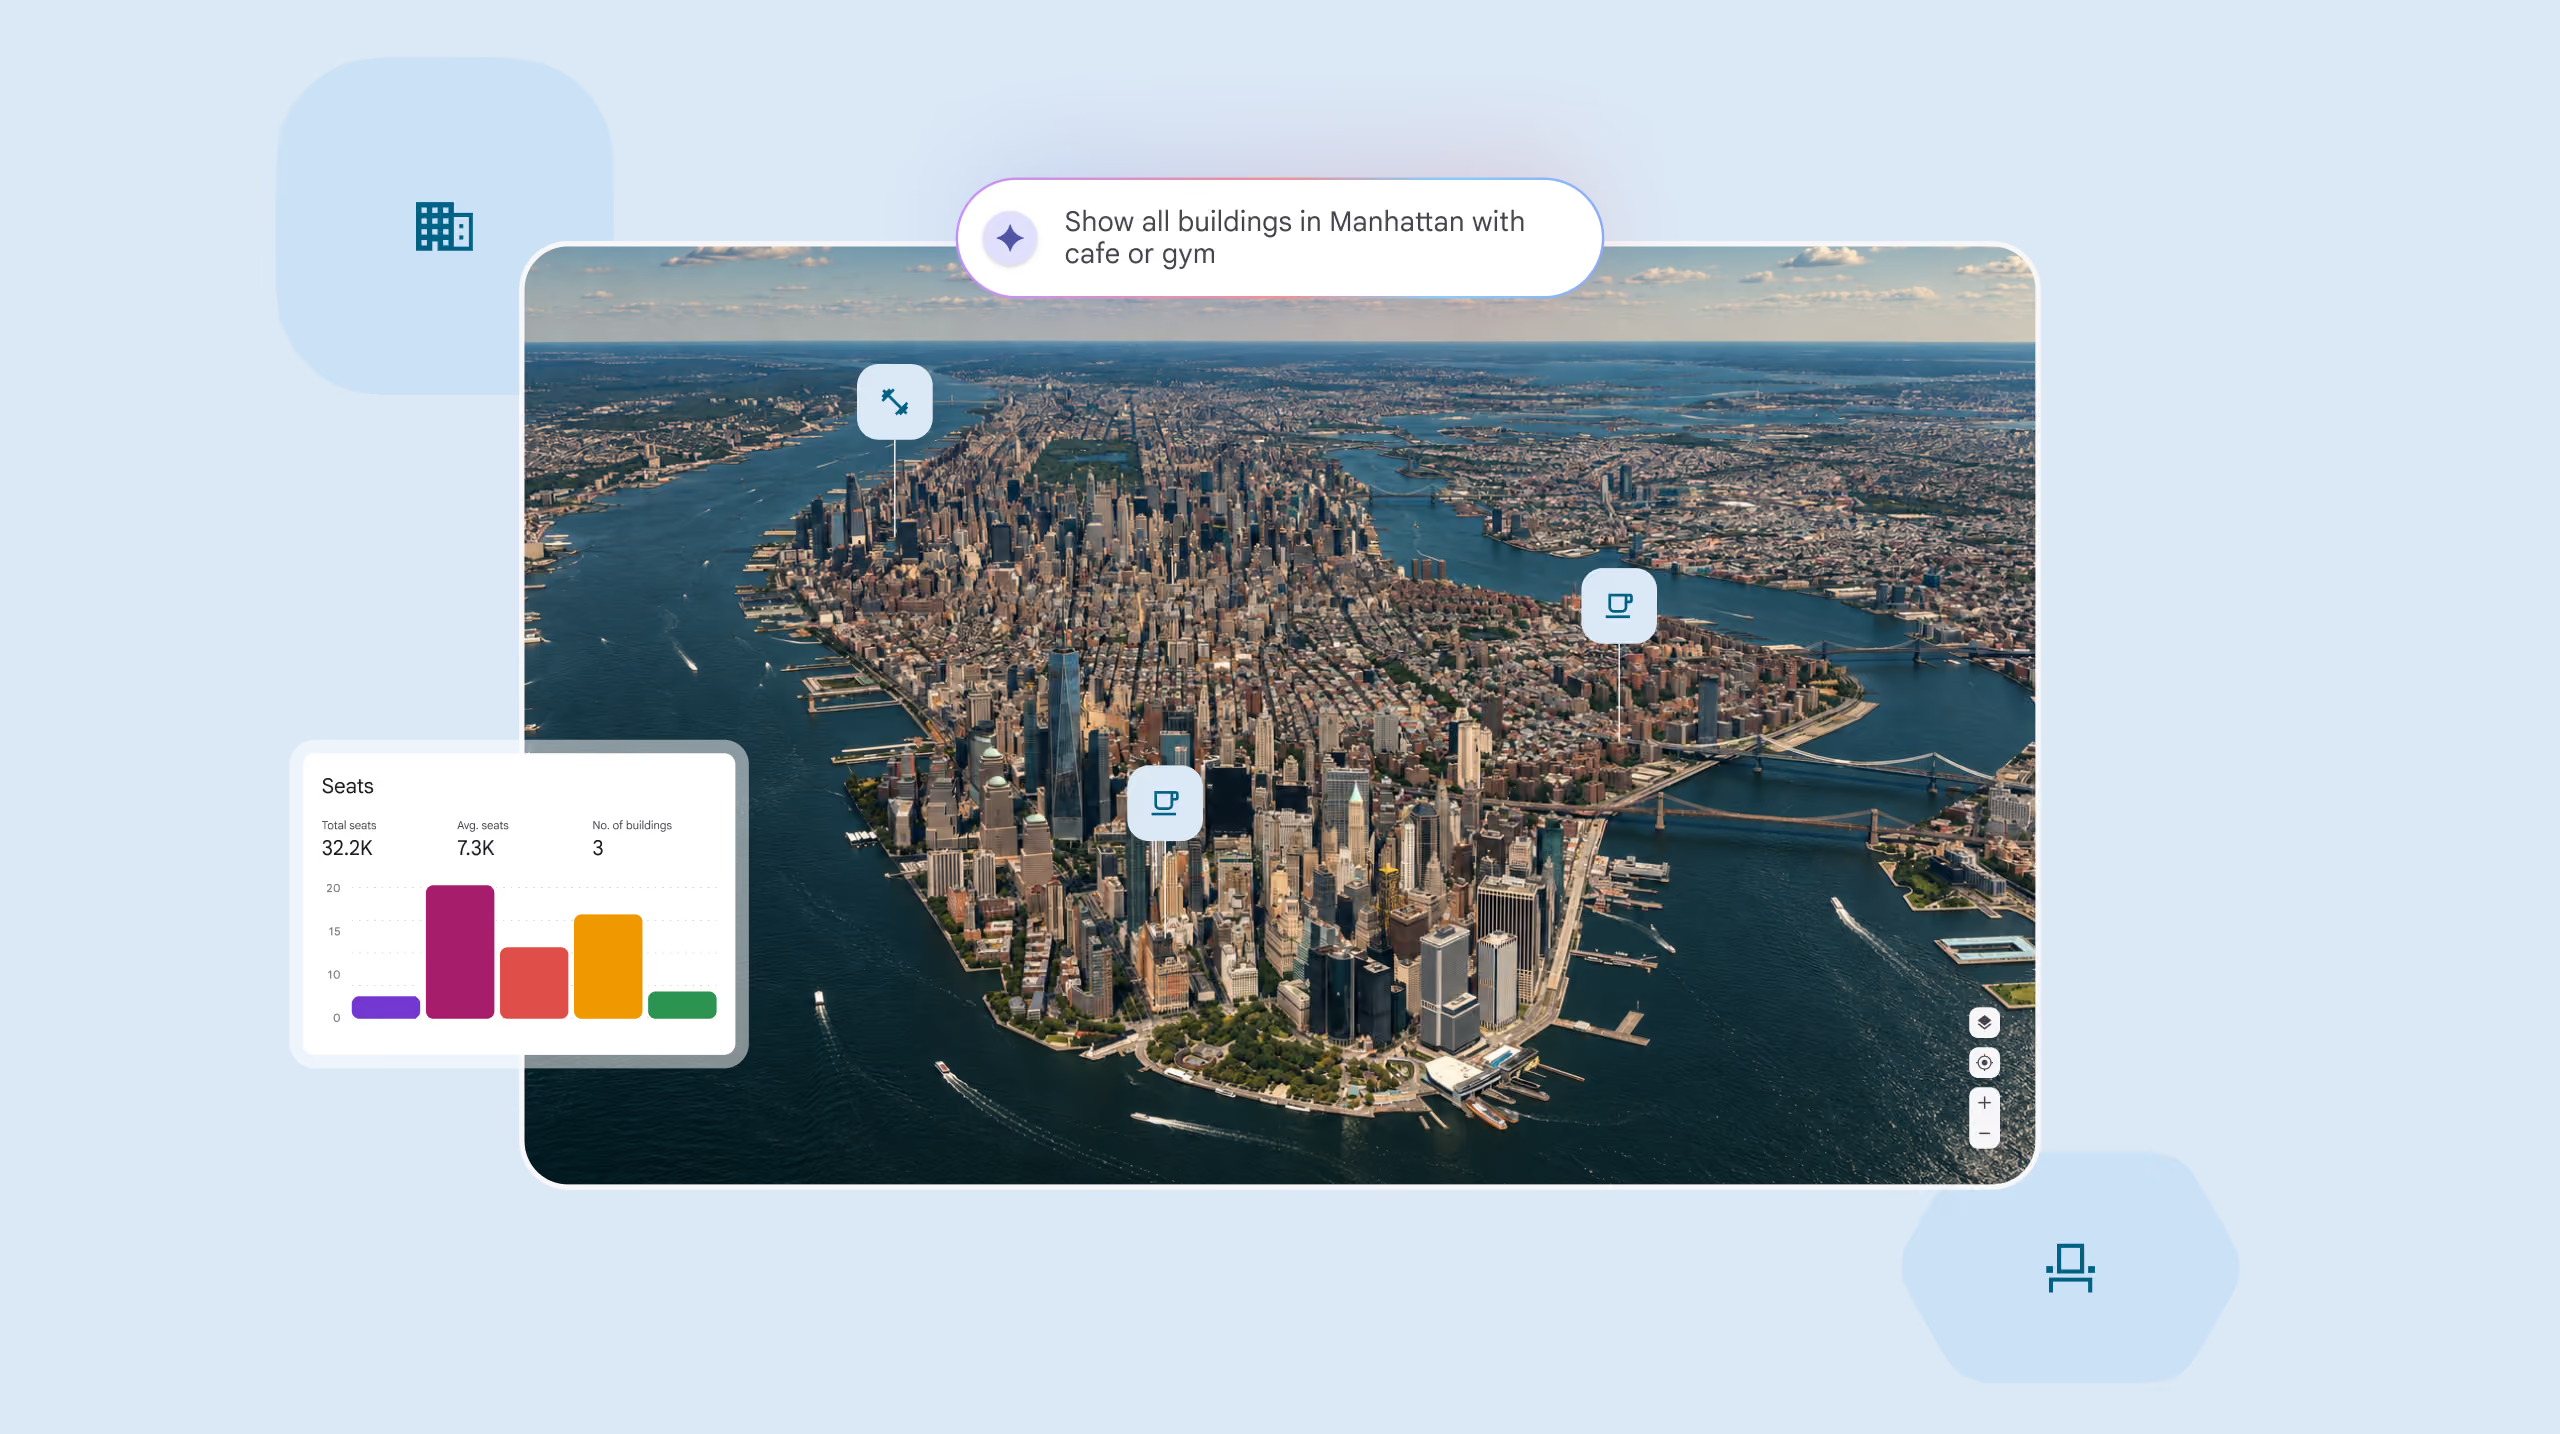
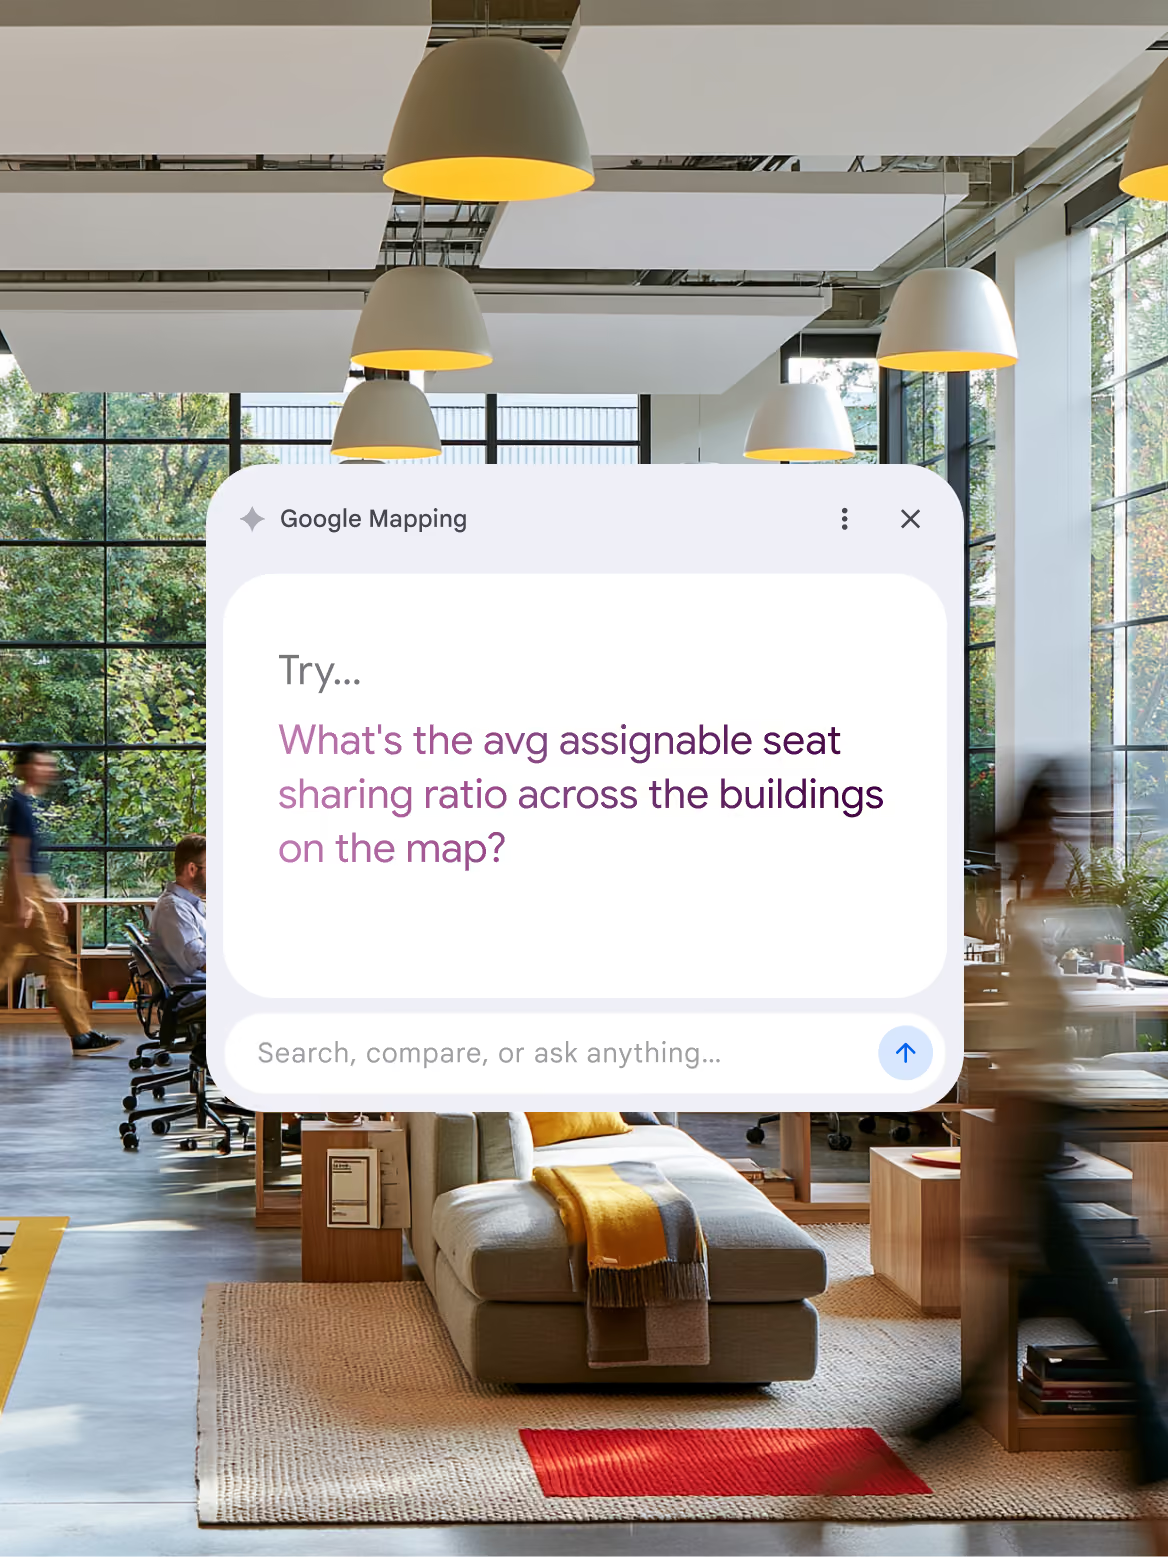
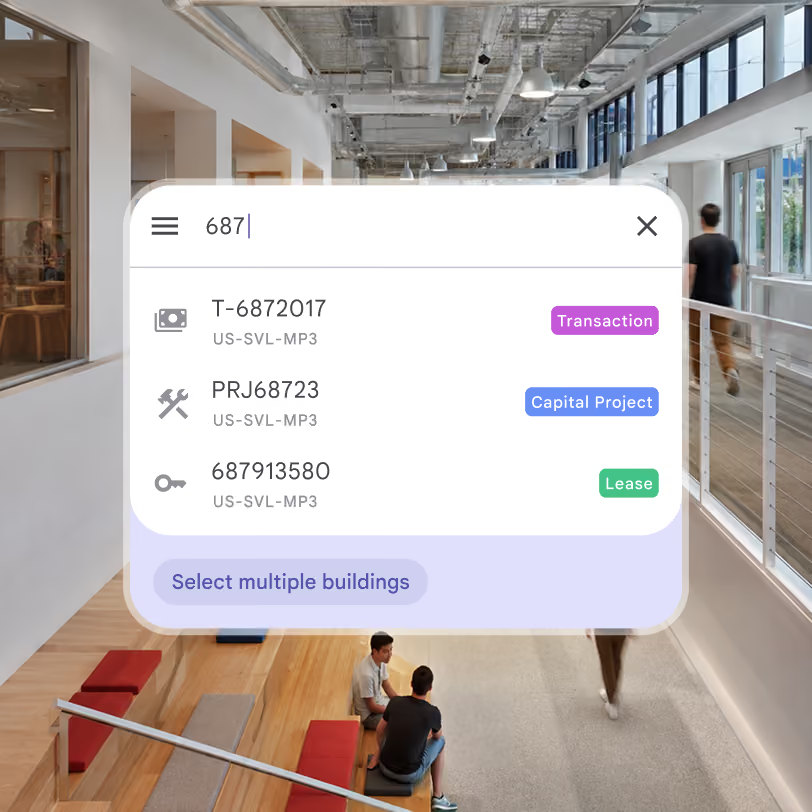
We built an interactive mapping product that brings portfolio, location, and operations data together. Teams can scan the full footprint, open any building, ask questions in plain language, and jump to the source when they need more detail.
Complex questions, without complex queries
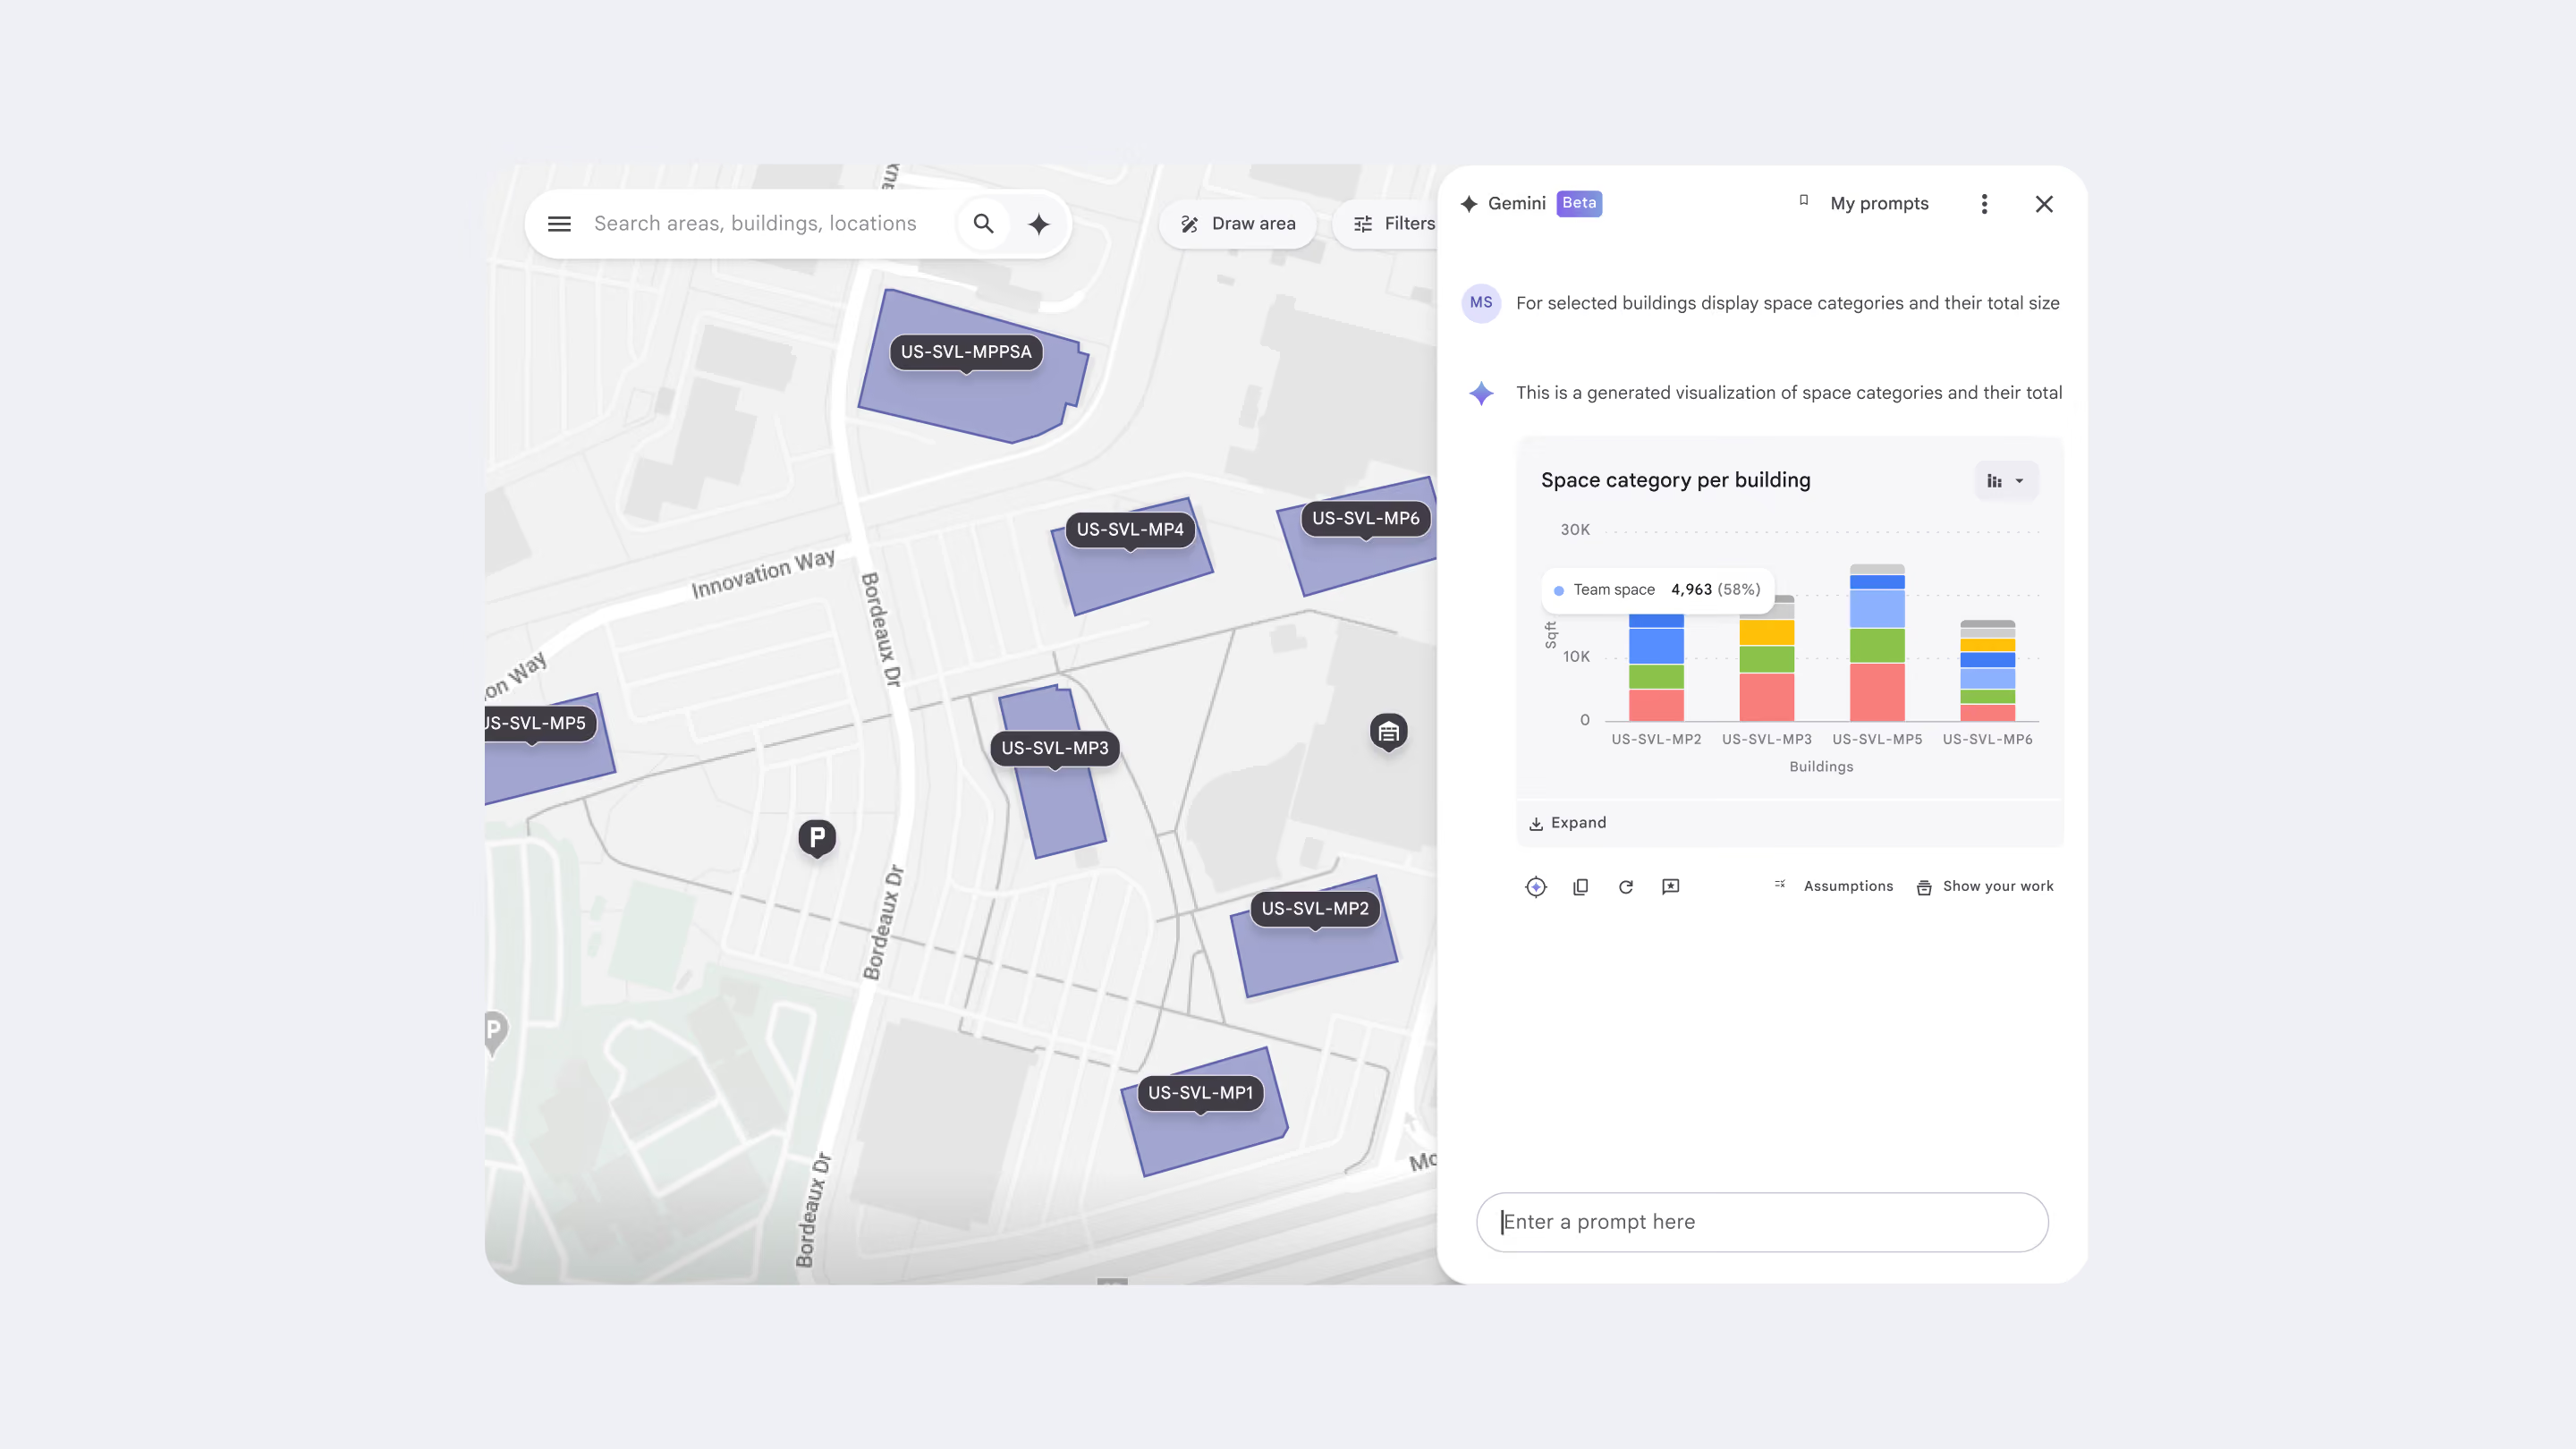
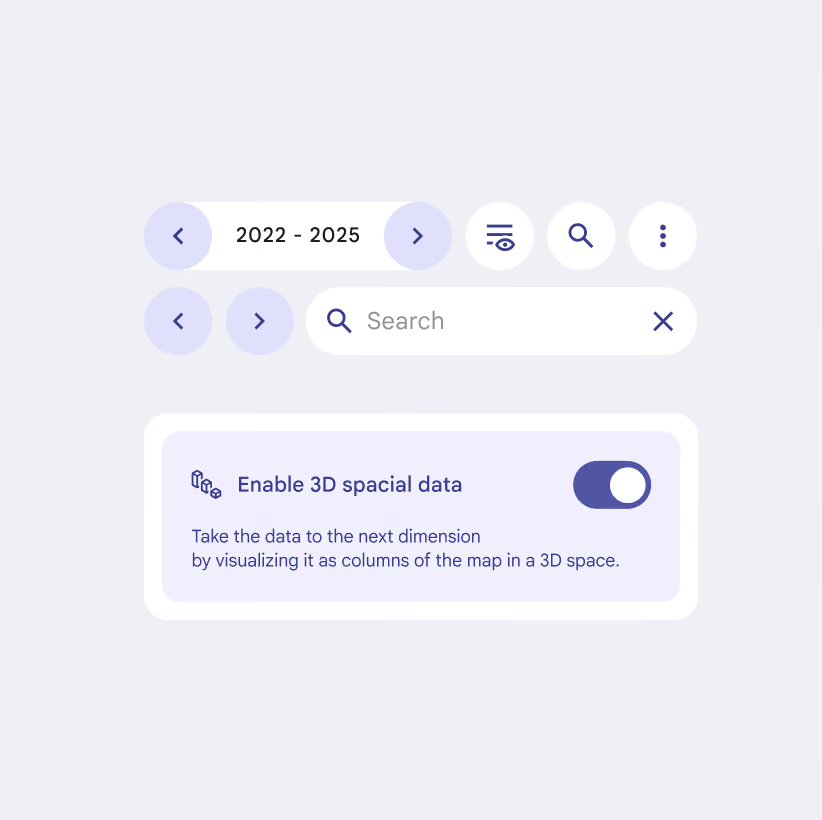
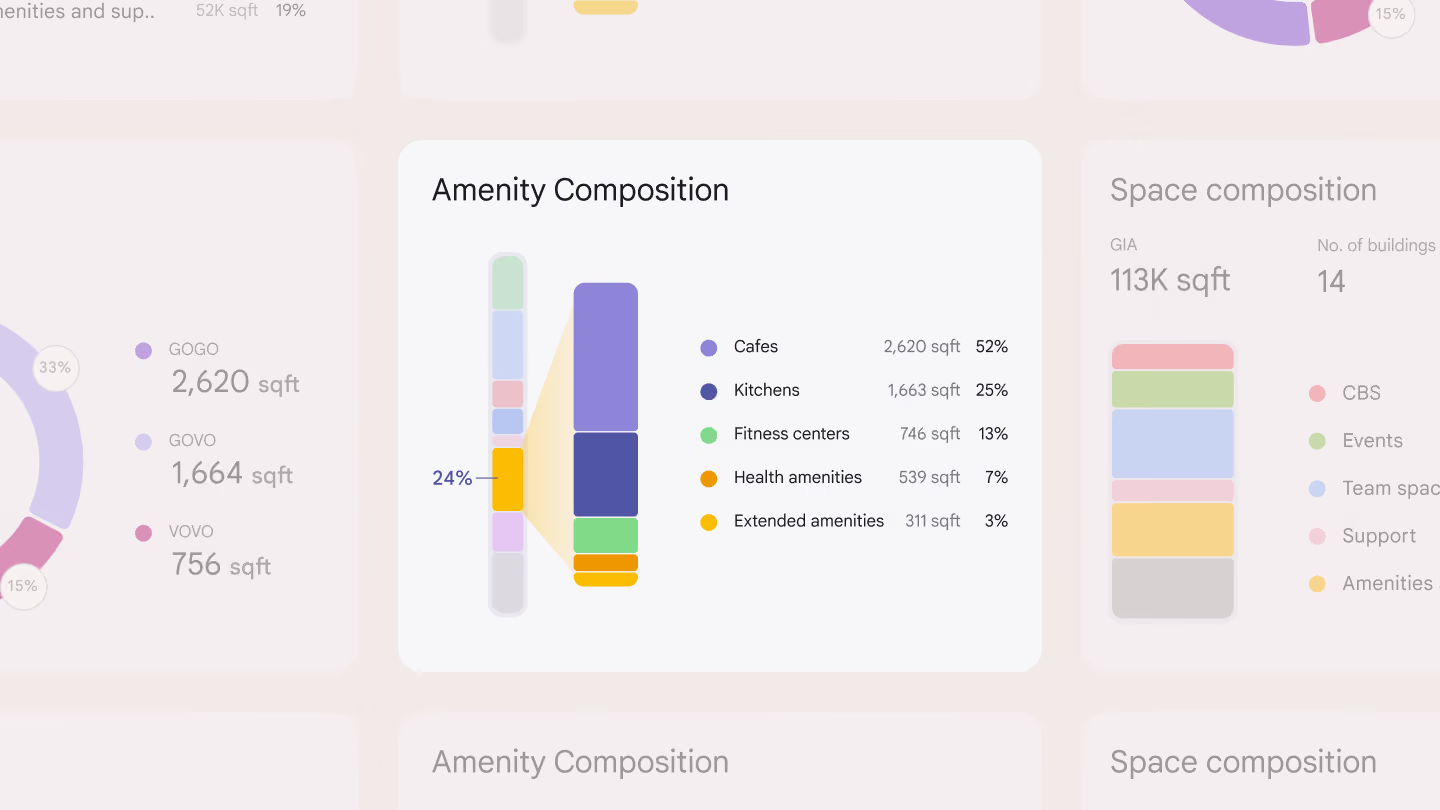
Start with a place, like San Francisco’s Financial District. See how seats are distributed across teams, ask a question, add constraints, and view the result as a chart or map overlay. Need more detail? Open the source system directly.
Plan better spaces, make faster decisions
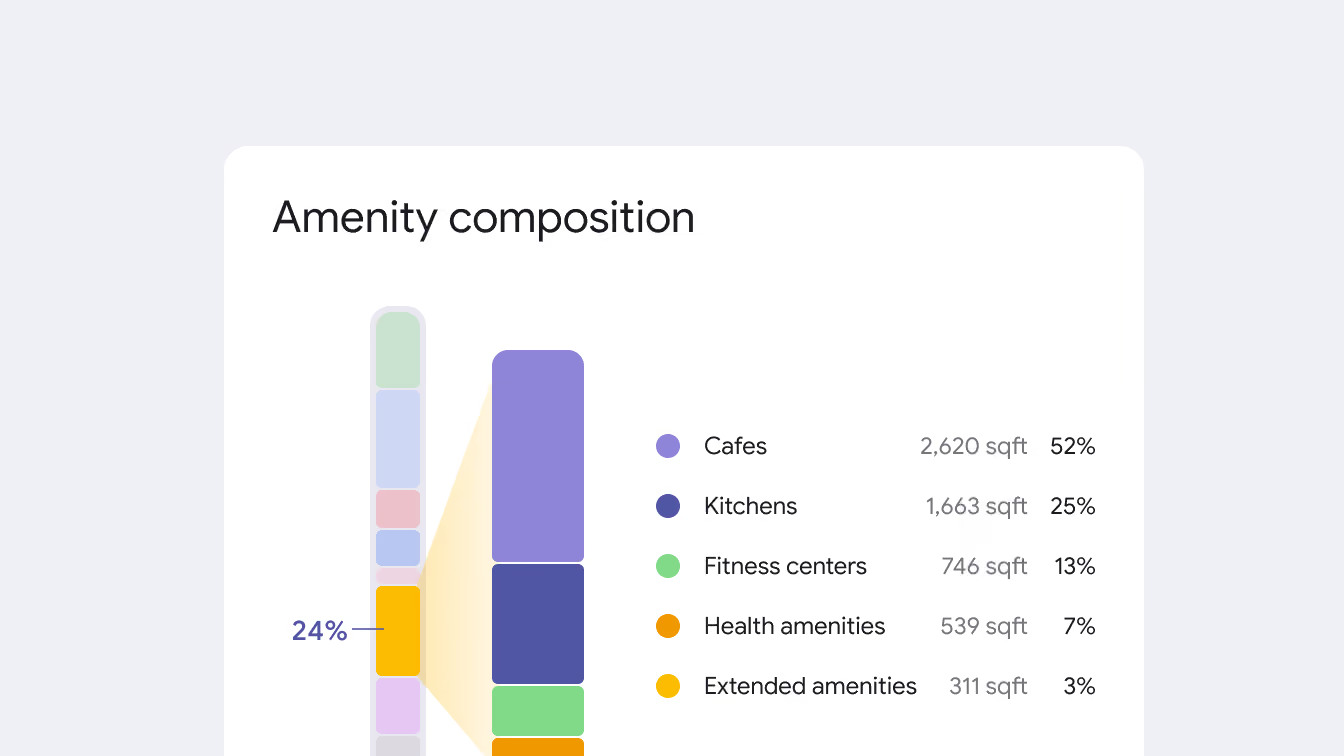
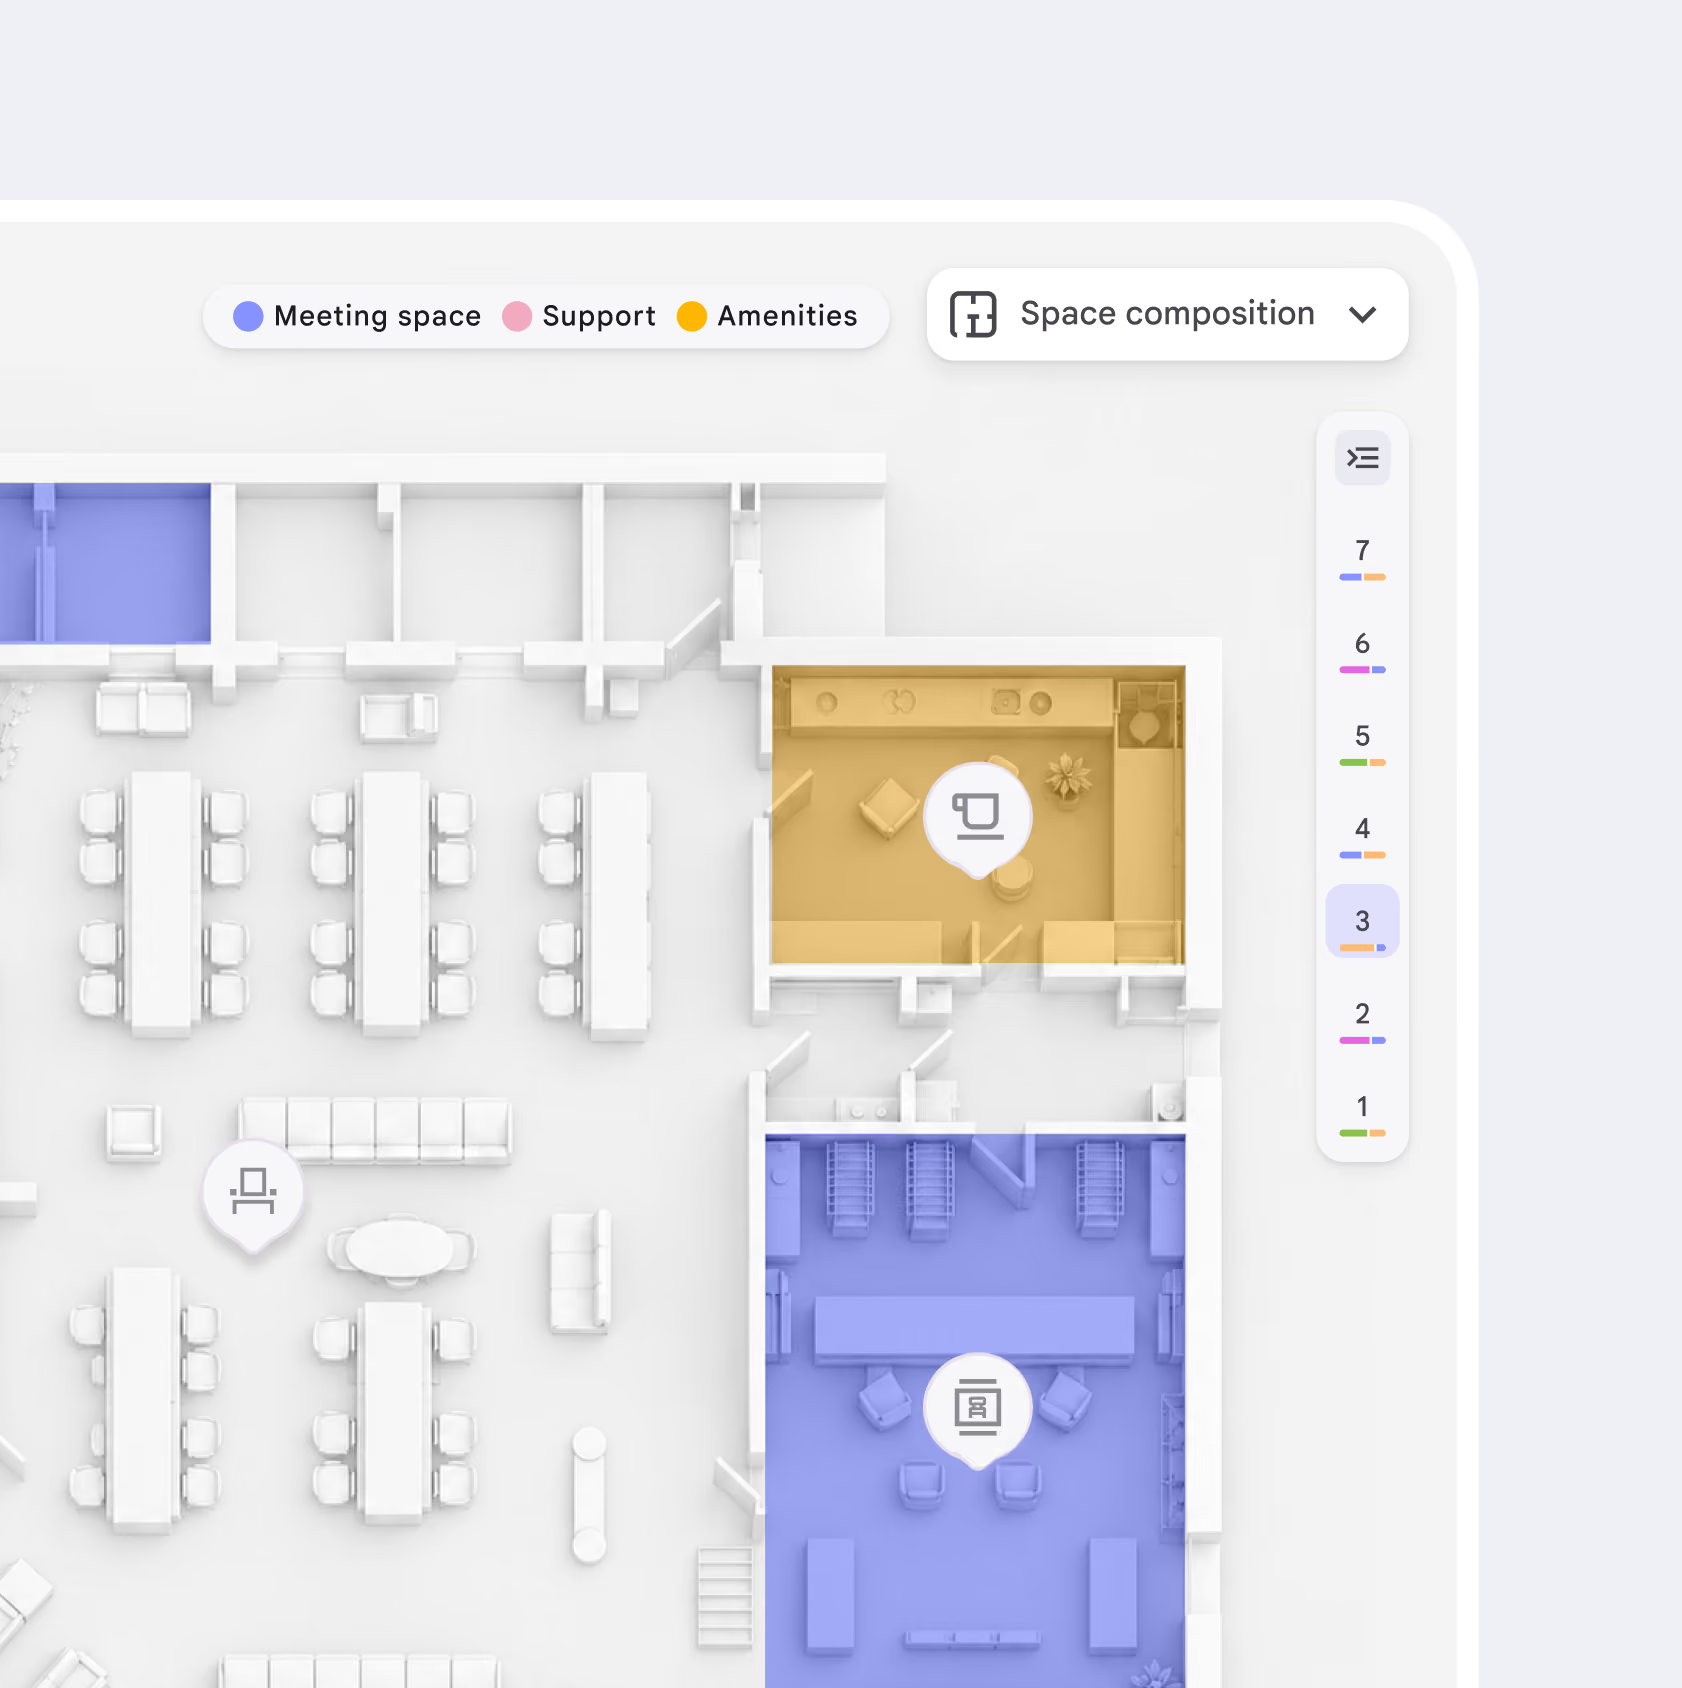
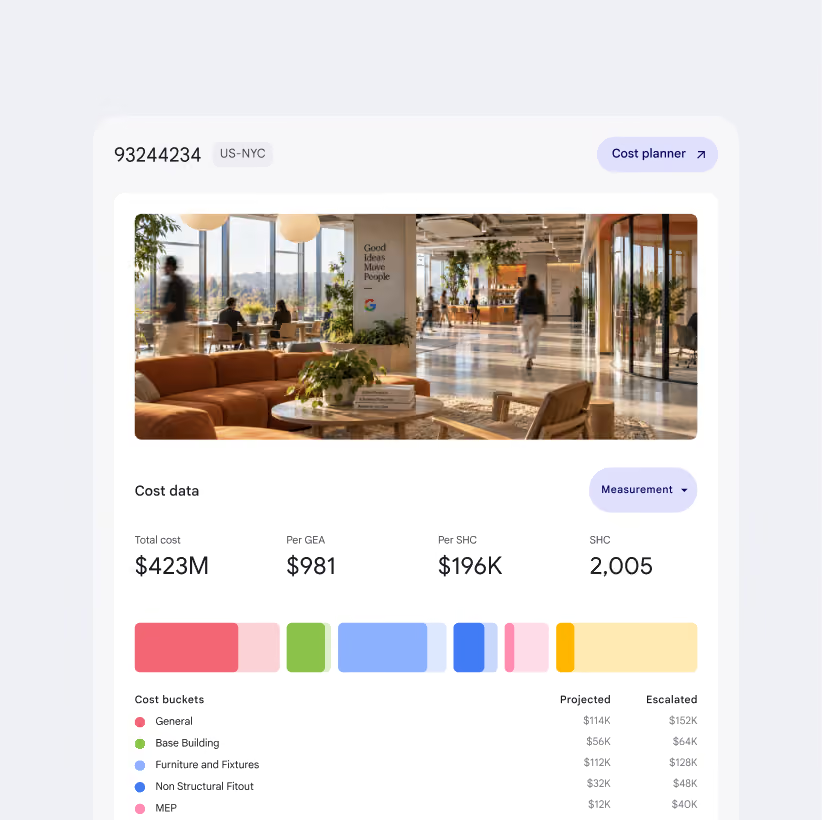
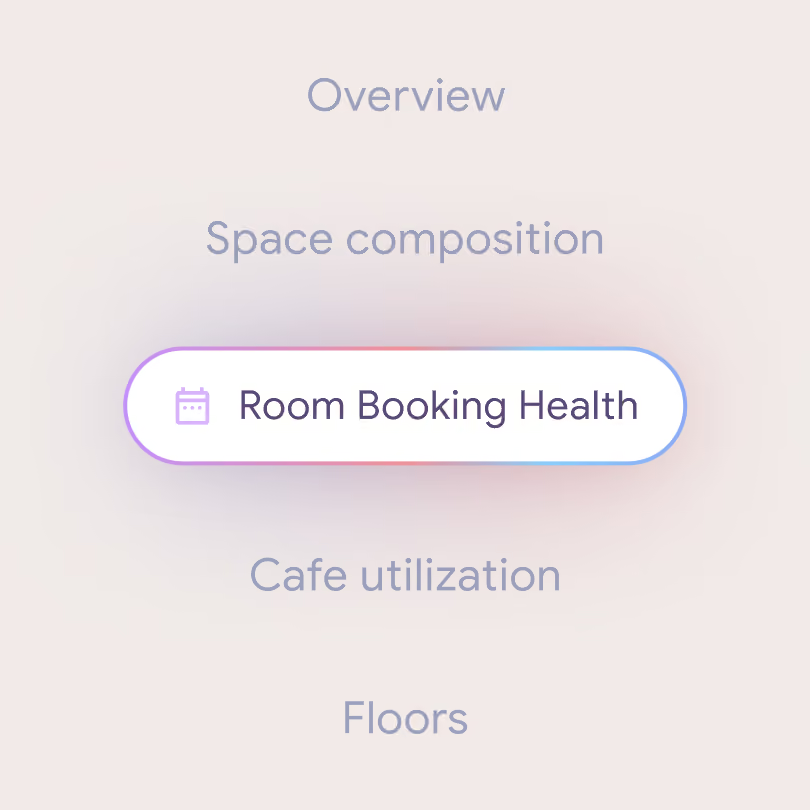
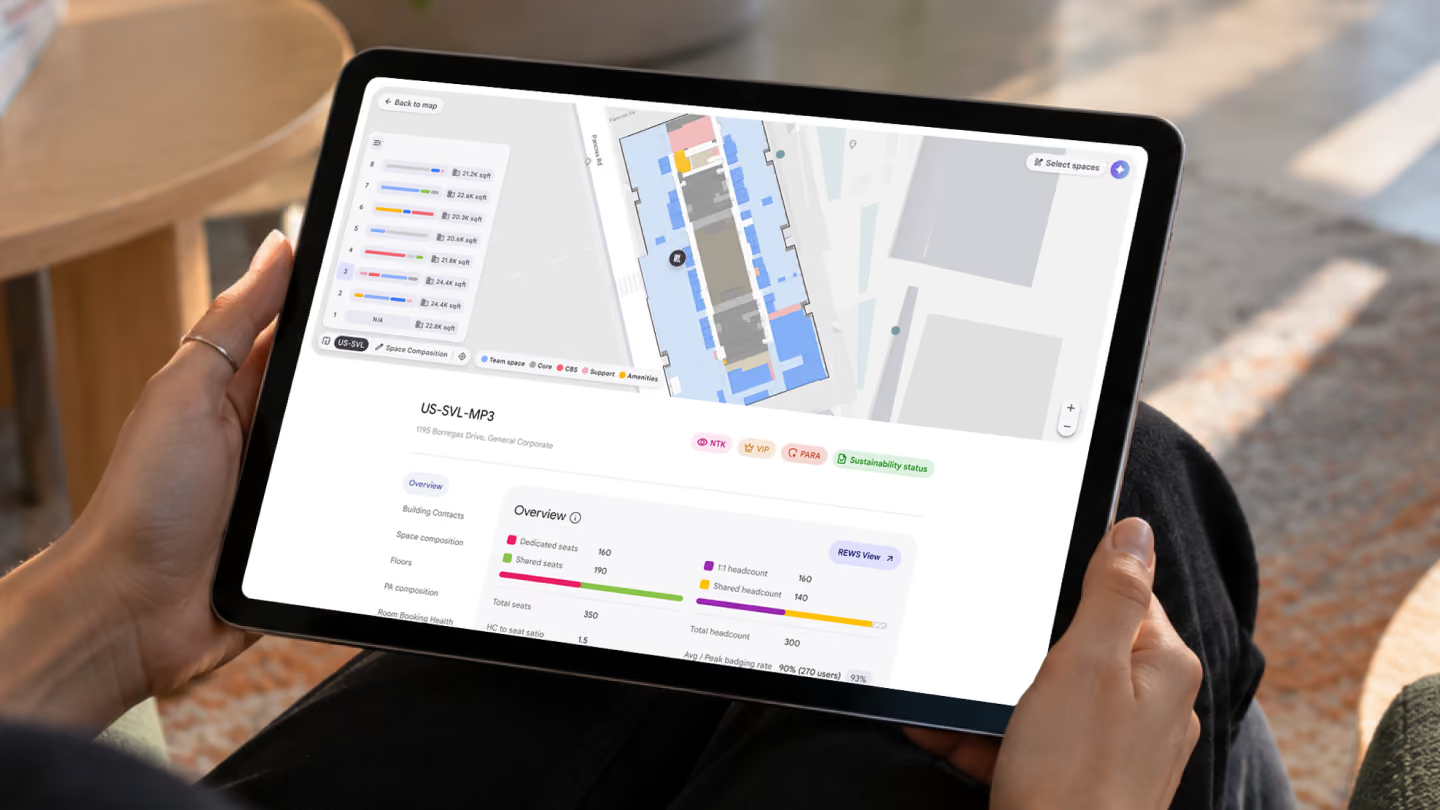
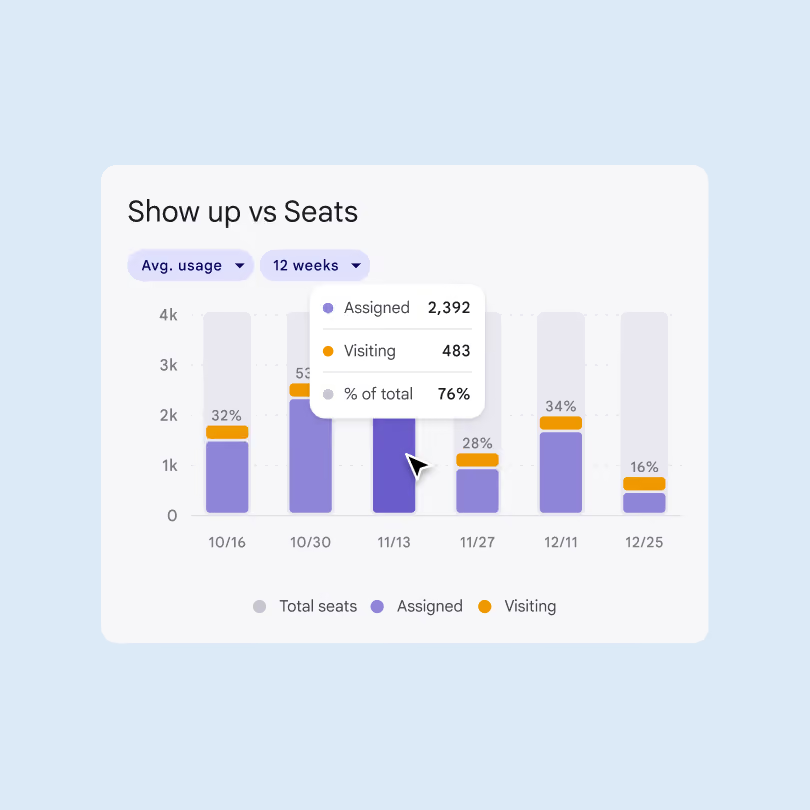
Drill into any building in one view. Floor plans showing space type and capacity. Headcount and utilization metrics. Capital costs and budgets. Renovation timelines. Teams get the context they need to make fast decisions about space allocation, staffing, and investment, without switching between systems.
Every answer shows the data behind it
For AI to be useful here, people need to know where an answer came from. Every result can be traced to the data behind it and the calculation used to get there.
That idea carries through the product. Cards give quick context, pins show building locations, and deep links take teams straight to the source when they need more detail.

“Any AI assistant only earns its keep if people trust its answers. So we built query transparency into the product from the start.”
From an initial idea to an operating platform that serves thousands
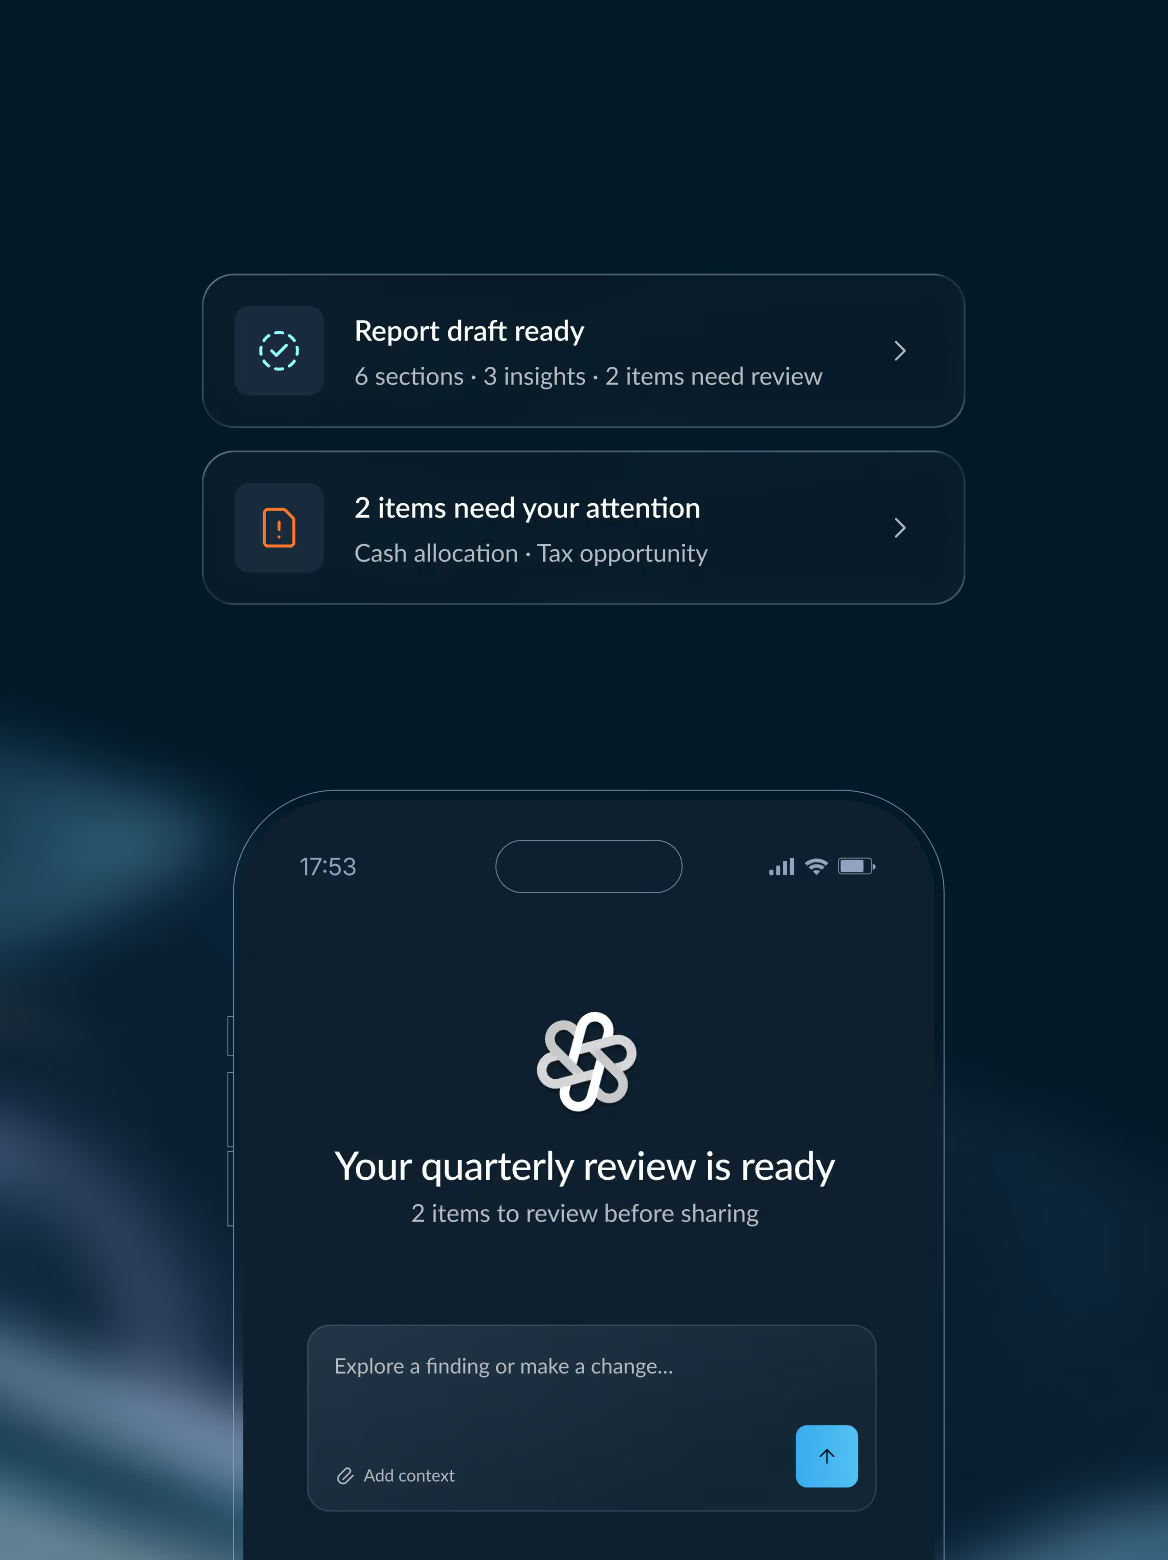
What started as a new way to visualize Google’s real estate portfolio became a shared platform for understanding it. As adoption grew, we expanded the product with new data, custom modules, AI capabilities, and integrations, opening the platform to new use cases and users beyond its original scope.
Today, the experience powers workplace operations globally, helping thousands of teams across Google answer building questions faster, identify risks and issues early, and keep millions of square feet of workplace running smoothly.
[]
Thousands
of users across Google
Millions of square feet
of space analyzed
10+ systems → 1 view
to answer questions about any building
.svg)